With all the changes that the commercial real estate (CRE) industry has seen this past year, we know that the best way to stay informed and to get ahead is through data collection. However, not all data is good data, and access to bad data — which may include vanity metrics and/or non-actionable data — can be deceivingly costly. In fact, IBM estimates that gathering the wrong data costs the US economy roughly $3.1 trillion dollars each year. Not only does this deficit lead to mistrust about data quality and validity across all industries, but it also risks negatively impacting a company’s bottom line.
With so many discrepancies involving data collection — and for CRE, with over 8,000 available technology partners emerging in the market, each of which collects its own data sets — how can property owners be sure that they’re doing all they can to collect the right, quality data, while also streamlining their processes to produce the best results? The answer resides in finding the right technology partner, such as HqO, that can help collect meaningful data about your assets while translating it in an easy-to-understand way that accelerates the innovation of your entire portfolio.
Refining the Data-Driven Model
In order to start collecting more meaningful data, we first need to discuss how CRE owners should think about their strategy for making more data-driven decisions. For CRE owners to find the metrics that best meet their goals, we suggest that they start looking for correlations between four key metric categories in order to increase their portfolio’s net operating income (NOI): outcomes, outputs, activities, and resources.
It starts with tuning in to the problems you want to solve most for your portfolio, and defining your desired outcomes. Once we define these outcomes, we can then use them to inform which metrics you need to look at — such as the measurables you can leverage immediately (outputs), the strategies you enact to achieve your goals (activities), and your inputs (resources) — and what other data you need to collect. Since not all metrics and data are equal, and some are better predictors of desired outcomes than others, the data you gather should help answer questions to take action today, while still getting you closer to your larger goals.

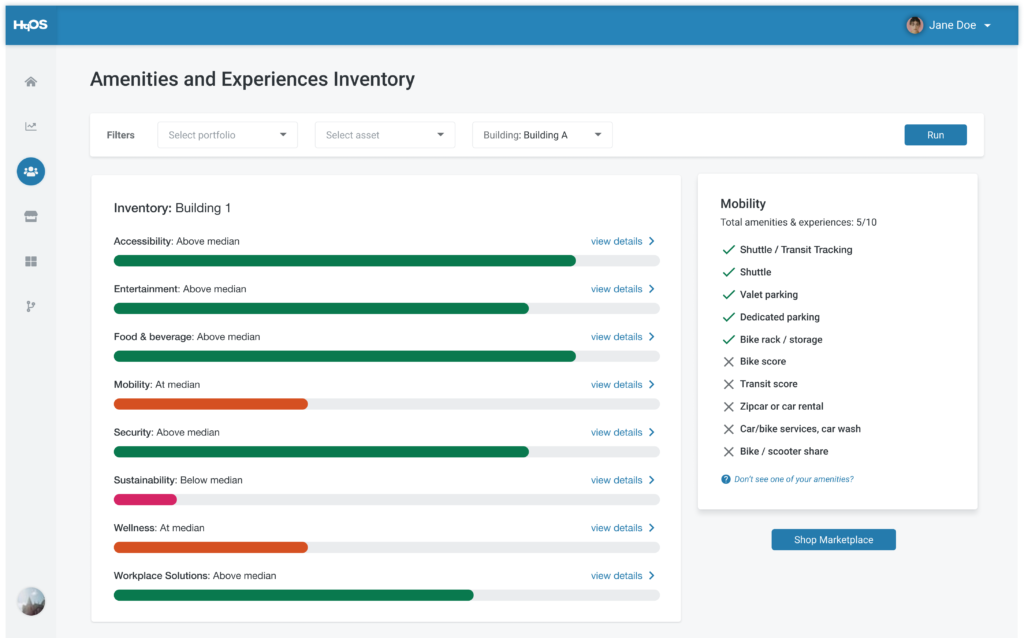
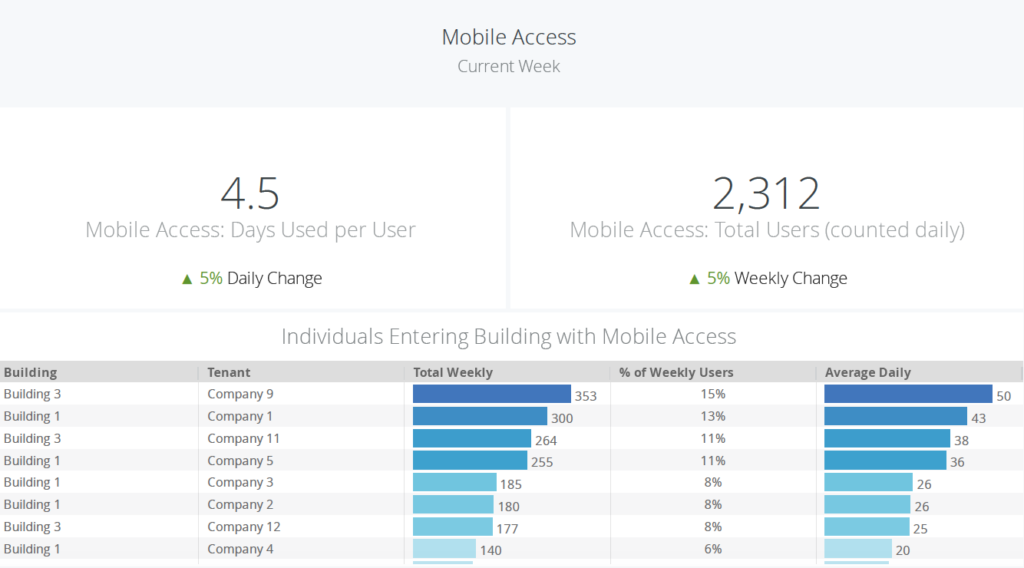
For CRE, these categories may play out as follows: A property manager wants to increase the retention rate in their building (outcome). In theory, a way they can get a tenant to retain its lease (output) is through tactics such as increasing tenant satisfaction, engagement, or brand awareness. To track this, they may enhance their building’s amenities and experiences (activities) to better understand the building population. The metrics they try to measure and refine (resources) would be factors such as amenity usage, mobile access entries, order ahead food preferences, service and class bookings, and more.
Leveraging Meaningful Data
Now that we know how we need to think about CRE data, we can dive into which data provides the actionable, meaningful information about your building. Vanity metrics are metrics that only measure surface-level digital engagement — such as content clicks about a certain amenity within an app. Though this type of information expresses interest and is a decent place to start, it doesn’t tell landlords much about the tenants’ actual experience with the amenity. Landlords need to collect and analyze a more specific series of metrics that deeply explain tenant behavior and sentiment, so that they can make decisions as soon as possible about their building while tracking their progress towards longer-term goals.
Let’s bring back the landlord example from earlier, and say you’re still focusing on increasing the retention rate in your building. Now, you want to facilitate a safe return to the workplace to increase the likelihood of retention. You will need to know how people physically and digitally engage with your building, how they feel about it, and how that changes over time. Soon, you discover — perhaps through a tenant-focused survey — that amenities draw people into your building. Tenants want to be able to safely take advantage of your spaces while maintaining social distancing. They also want the conveniences of using your gym, mobile food services, parking, etc. More importantly, they want clear and consistent communication around the topic, so that even those who work from home can feel informed about their workplace options.

This indicates that you need access to granular data to make more informed decisions around your building’s amenities. You may look at digital engagement (or clicks) with content/information on your amenities, tenants’ satisfaction with those amenities, mobile access data to those amenities, equipment sensor data associated with those amenities, class or service bookings, and so on. The more activations your building features have, the more data points you can combine to paint a more holistic picture of which amenities see the most traffic, which ones need improvement, and more — showing you how your building is actually being used.
It’s not uncommon for landlords to invest in technologies that only provide vanity metrics, instead of the quality metrics they need to understand their building occupants. Truly unlocking actionable data and insights that go beyond the surface-level requires a single platform with rich, API-based integrations that tie together all aspects of the tenant experience. Without these deep integrations, the technology trail ends abruptly, leaving property owners with no additional information that they can apply to their assets. This is why true API-based integrations — which can be found in HqO’s growing technology ecosystem — are so important. These technology connectors go beyond the initial click, capturing significantly more data because they’re both native and trackable. Their interoperability with the HqOS operating system also guarantees that not only will you be able to capture more data, but you will also be able to organize and view this data all from a single location.
HqOS™: CRE’s Differentiator
Since digital transformation is fairly new to CRE, finding meaningful metrics about your building can be few and far between — and even more difficult to organize. Luckily, the HqOS end-to-end operating system provides CRE owners with a leap in the right direction. The three layers of HqOS — which include our Marketplace, Tenant Experience Platform, and the Digital Grid™ — work seamlessly together to produce compounding positive results for any portfolio.
Our growing Marketplace of best-in-class technology partners — which can be accessed through the Tenant Experience Platform — enables landlords to activate more of their building features, while simultaneously providing tenants with a better experience and property managers with a higher volume of rich data. The Digital Grid then takes these activations a step further, serving as a connected and streamlined analytics offering that can collect tenant behavior, amenities, technologies, and building data all in a single location. By centralizing and structuring data within our CRE-specific data model, it helps owners and operators uncover insights, take action to differentiate their assets, and make intelligent decisions across their portfolio.

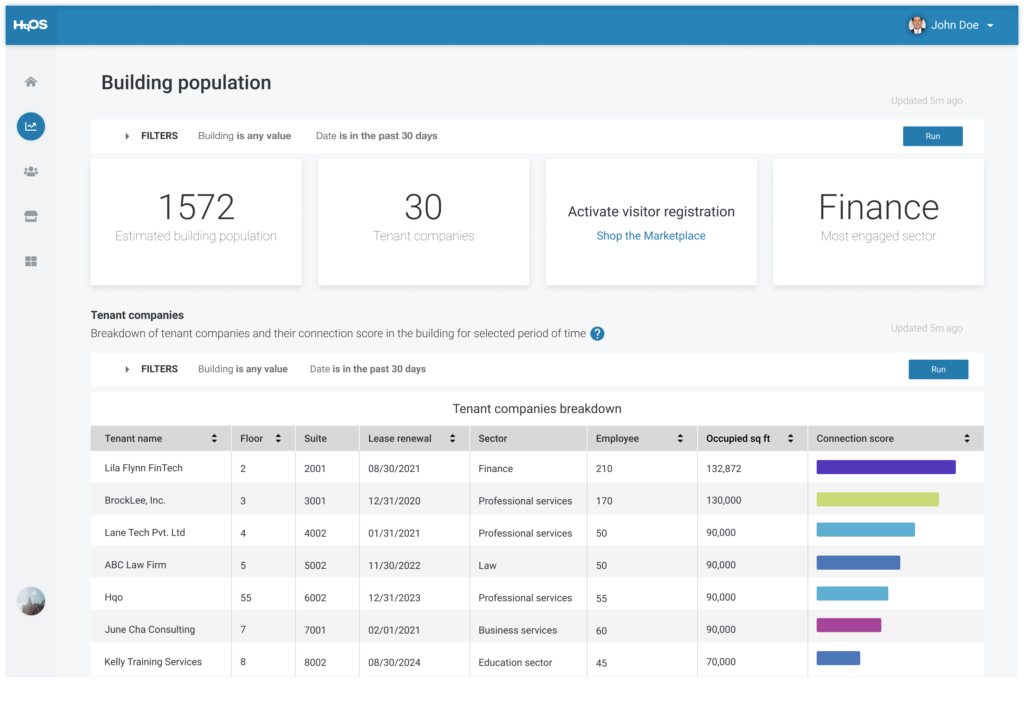
For example, our Building Population Report™ combines behavioral and contextual data to give asset managers and property teams a better understanding of their tenants. This report produces a “Connection Score” for each tenant, which combines each tenant’s engagement with building features — such as booking a conference room — with the number of users and technology tools activated at the property. The more connected a tenant is, the more we know about them, allowing property teams and asset managers to make smarter decisions at their assets.
Additionally, to optimize our tools for your portfolio’s unique needs, landlords can take advantage of our dedicated team of technology experts. Our Solutions Architects can help determine the most significant data points for any building, while leveraging HqOS’ technology infrastructure to take that data and standardize — helping to inform decisions and produce high-quality, custom solutions. Our ongoing consultation and technology support allows landlords to see if their actions actually changed the metrics they were aiming to change, while also cutting down on costs and time for property teams.
In an ever-evolving market, you won’t be able to stay ahead of the curve if you’re not strategic about the types of data you collect and the ways you collect it. To become better data-driven decision makers, learn more about HqOS and schedule a demo today.


